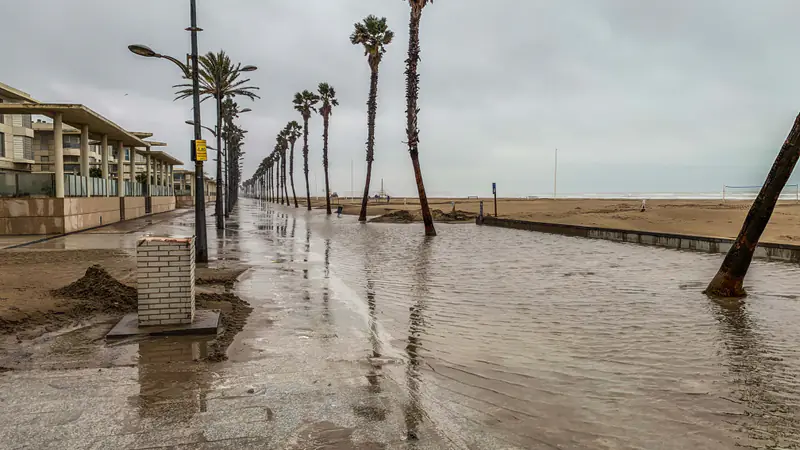
What happened
Storm Daniel hit central Greece in early September 2023. According to NASA's Earth Observatory, the four-day storm began on 4 September and dropped record rain on Thessaly on 5 September. It was a cut-off low, a low-pressure system that had stalled after separating from the jet stream, and it was part of an unusual "omega" pattern over Europe.
The numbers are extreme. NASA reports that the highest rainfall, 754 mm, fell on Zagora on Mount Pelion, near Volos. Over the four days, stations of the Greek weather service Meteo recorded about 910 mm at Zagora and 659 mm at Karditsa, even though some stations stopped sending data during power cuts. For scale, Athens averages about 400 mm of rain in a whole year.
In Volos, the Krafsidonas river broke its banks and destroyed a bridge. The water then spread across the Thessalian plain. On 10 September a Sentinel-2 image showed the Larissa area still badly affected by the overflowing Pinios river, and by then firefighters had rescued more than 2,850 people, according to the EU Space programme.
What Copernicus EMS mapped
The EU's Copernicus Emergency Management Service (EMS) turns satellite images into maps for civil protection. Its rapid mapping was activated on 5 September 2023 at the request of Greece's General Secretariat for Civil Protection, under the code EMSR692. The first notice, written while rain was still falling, already reported one person dead and one missing around Volos and the Pelion coast. The request was for a first rough estimate, the flood extent and monitoring over time.
The activation grew as the water moved inland. Its public record lists 7 areas of interest (Magnesia, Palamas, Larissa, Stefanovikio, Karditsa, Keramidi and Kalamaki) and 29 products. They are flood delineation maps, repeated as "monitoring" updates through to 22 September. They combine radar images from Sentinel-1, which see through cloud, with very high resolution optical images from commercial satellites.
By 21 September, the EU Space programme reported that the floods had caused damage to over 700 km² of Greece's central agricultural belt, with some fields still under water.
Three months later: Lake Karla
The water did not simply drain away. Copernicus EMS opened a second, slower activation, EMSN184, under its risk and recovery mapping, dated 23 November 2023. It was for Greece's Ministry of Rural Development and Food, to support recovery planning in the area north and north-west of Lake Karla. Using a Sentinel-1 image from 18 December 2023, refined with a Sentinel-2 image from the next day, the analysis found about 10,000 hectares still flooded. An impact assessment combined that extent with reference data and WorldPop population estimates.
National data mattered too. A Copernicus in-situ case study notes that a Greek 5-metre digital terrain model, provided through the General Secretariat for Civil Protection, was used to estimate water depth.
Lessons for flood planning
We draw these from the public record above. They are our reading, not official conclusions.
- Plan for the long tail, not just the peak. In a flat basin, the damage continues for months. Recovery plans for farms, roads and services need flood duration, not only maximum extent.
- Combine satellites with terrain. A satellite shows where the water is. A good terrain model shows how deep it is and where it will go next. Each needs the other.
- Keep hazard maps alive. The EU Floods Directive requires flood hazard maps, flood risk maps and flood risk management plans, reviewed in six-year cycles (the current one runs 2022–2027). Events like Daniel are the evidence those reviews should use.
- Replay the event. The EMSR692 maps form a day-by-day record of how the water spread. Running a flood model against that record is one of the best ways to test it before the next storm.
Where a digital twin fits
A flood twin would join rainfall forecasts, terrain, rivers, land use and the location of people and assets, so planners can ask "what if this much rain falls here?" before it does. It cannot remove uncertainty, and it does not replace official warnings or the Floods Directive maps. Kassandra Labs is at concept stage; our flood risk page sets out how such a twin could support planning.
Sources
- Copernicus EMS — "Flood in Greece" (EMSR692 activation notice), 5 Sep 2023
- Copernicus EMS — EMSN184, Risk and Recovery Mapping: Flood in Thessaly Region, Greece
- EU Space / Copernicus — Image of the day: agricultural areas around Thessaly remain flooded, 21 Sep 2023
- NASA Earth Observatory — "A Deluge in Greece", 9 Sep 2023
- European Commission — Floods (Floods Directive 2007/60/EC)