Drought vs water scarcity: what is the difference, and how is each measured?
The two words are used as if they meant the same thing. They do not. A drought can end with one wet winter; water scarcity is about how much water we use, and it can outlast many good winters.
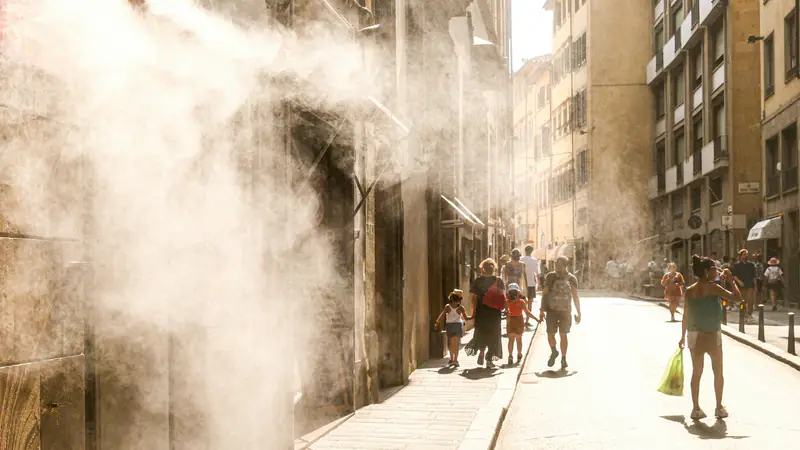
Drought is weather; water scarcity is demand outrunning supply
The European Commission gives two separate definitions:
- Drought is a temporary drop in the water that is normally available, mainly because less rain fell. It is a natural event and can happen anywhere in Europe, in any season.
- Water scarcity is a seasonal, annual or multi-year condition of water stress, when demand frequently exceeds what the natural system of a river basin can supply sustainably. Pollution that reduces clean water can also cause it.
Put simply: drought is about what the sky supplies; scarcity is about the balance between what we take and what is renewed. The two are linked. A drought can push an area that was already near its limit into scarcity, while an area with very heavy use can face scarcity even in a normal year.
| Drought | Water scarcity | |
|---|---|---|
| What it is | Temporary drop in available water | Demand frequently above sustainable supply |
| Main cause | Too little rain (natural) | How much and how water is used; pollution |
| Duration | Temporary | Seasonal, annual or multi-year |
| European indicator | SPEI, Combined Drought Indicator | WEI+ |
Water scarcity: the causes
According to the European Environment Agency, agriculture, public water supply and tourism put the most pressure on freshwater in southern Europe. In general, scarcity peaks from April to September, when it is dry, river flows fall and abstraction for irrigation, tourism and recreation rises.
Physical vs economic water scarcity
A review in Ambio (Damkjaer & Taylor, 2017) describes a further distinction. Physical scarcity occurs when more than 75% of river flows are withdrawn for domestic, industrial and agricultural use. Economic scarcity occurs when renewable resources are adequate and withdrawals are below 25% of river flows, but the infrastructure to make the water accessible is missing. The authors note that both categories rely on expert judgement.
What is the Falkenmark indicator?
The Falkenmark indicator measures renewable freshwater per person per year. The same review gives thresholds of 1,700, 1,000 and 500 m³ per person per year: above 1,700 m³ there is no stress, and below 500 m³ the stress is "absolute". The labels for the middle bands vary between sources. The authors point out that the thresholds were adopted without an empirical basis and that an annual average hides season-to-season swings, which matter a lot in a country with dry summers like Greece.
How drought is measured: SPEI and the Combined Drought Indicator
The European Drought Observatory (EDO) is part of the Copernicus Emergency Management Service and is run by the Commission's Joint Research Centre (JRC). It publishes maps of drought indicators, plus layers on heatwave intensity. Two indicators are worth knowing.
SPEI
The Standardized Precipitation Evapotranspiration Index was proposed by Vicente-Serrano and colleagues in 2010. As the NCAR Climate Data Guide explains, it starts from the climatic water balance: precipitation minus reference evapotranspiration. Unlike the older SPI, which looks only at rainfall, SPEI also captures how much water the air demands when it is hot. It is computed over windows of 1 to 48 months and is standardised: 0 is typical, negative values mean drier than usual.
Combined Drought Indicator (CDI)
The CDI, developed by Sepulcre-Canto and colleagues (2012), combines three layers: the SPI rainfall index, the soil moisture anomaly and the fAPAR anomaly, which shows how healthy vegetation is. According to the indicator description, the levels are stepped:
- Watch: rainfall is below normal.
- Warning: soil moisture is in deficit.
- Alert: vegetation shows signs of stress.
- Recovery: stages of return towards normal.
How to read it: open the EDO map, pick the latest ten-day period and find your area. The colour shows which step it is on. An area on "Watch" is not yet damaged, but it has had less rain than normal and is worth following. The CDI was designed mainly for agricultural drought, so on its own it does not tell you how much water a city's reservoirs hold.
How water scarcity is measured: WEI+
The EEA tracks scarcity with the Water Exploitation Index plus. It compares consumption, meaning water abstracted minus water returned to the environment, with renewable freshwater, per river basin and per quarter. Above 20%, resources are under stress. Above 40%, the stress is severe and use may be unsustainable. There is no formally agreed EU threshold.
In the 2023 data, published in November 2025, water scarcity affected 28% of EU land and 32% of its population in at least one season. The Commission gives 29% and 38% respectively for 2019, and puts the cost of droughts in the EU at €2 to 9 billion a year.
What the indicators show for Greece
- Scarcity: the EEA lists Greece among the countries with water scarcity mainly in spring and summer 2023, with sub-basins where seasonal WEI+ exceeded 20%.
- Drought, 2024: for southeastern Europe, which in the Copernicus definition includes mainland Greece north of the 39th parallel, summer 2024 was the driest in a 12-year record, and summer river flow was notably or exceptionally low on 35% of rivers.
- Drought, 2026: in the JRC analyses, Alert conditions increased in Crete in late March 2026, while the mid-October 2026 analysis shows local recovery or normal conditions in Greece, with the Balkans still under Warning and Alert.
Droughts also affect health. Climate-ADAPT lists, among other things, hygiene problems when clean water is short, water-borne and mosquito-borne diseases, and poor air quality from wildfires.
Water shortage in Athens: the reservoirs
For Athens, the number that matters is not a European map but the stock in EYDAP's reservoirs. What the figures show, and why a single forecast is not enough, is covered in our article on water shortage in Greece.
Kassandra Labs is at concept stage and does not produce its own drought indicators. For current conditions, the official sources are the EDO maps and the water utilities' own data.
Frequently asked questions
What is the difference between drought and water scarcity?
Drought is a temporary drop in available water, mainly from low rainfall, and it is a natural event. Water scarcity is when demand for water frequently exceeds what a river basin can supply sustainably. The first is about weather; the second is about the balance between water use and renewal. A drought can make existing water scarcity worse.
What causes water scarcity?
Scarcity happens when more water is taken than is renewed. In southern Europe, according to the European Environment Agency, agriculture, public water supply and tourism put the most pressure on freshwater, with a peak from April to September. The European Commission adds pollution, which reduces the clean water available. Droughts make the problem worse.
What is the Falkenmark indicator?
It measures renewable freshwater per person per year, with thresholds at 1,700, 1,000 and 500 m³ per person: above 1,700 there is no stress, below 500 the stress is considered absolute. It is simple, but a 2017 review in Ambio notes that its thresholds lack an empirical basis and that an annual average hides seasonal swings.
Where can I check drought conditions in Greece?
On the maps of the Copernicus European Drought Observatory (EDO). Its Combined Drought Indicator shows whether an area is on Watch (low rainfall), Warning (dry soil), Alert (stressed vegetation) or recovering, with analyses organised by ten-day period. For Athens' water supply, the source is the reservoir data published by EYDAP.
Sources
- European Commission — Water scarcity and droughts
- European Environment Agency — Use of freshwater resources in Europe (indicator, Nov 2025)
- Copernicus Emergency Management Service — European & Global Drought Observatories (JRC)
- U.S. Drought Portal — Combined Drought Indicator (CDI), European Drought Observatory
- European Commission JRC — Current drought situation in Europe
- NCAR Climate Data Guide — Standardized Precipitation Evapotranspiration Index (SPEI)
- Damkjaer S. & Taylor R., "The measurement of water scarcity: Defining a meaningful indicator", Ambio 46(5), 2017
- Climate-ADAPT (EEA) — Drought and water scarcity: health impacts
- Copernicus — ESOTC 2024: Heat and drought in southeastern Europe