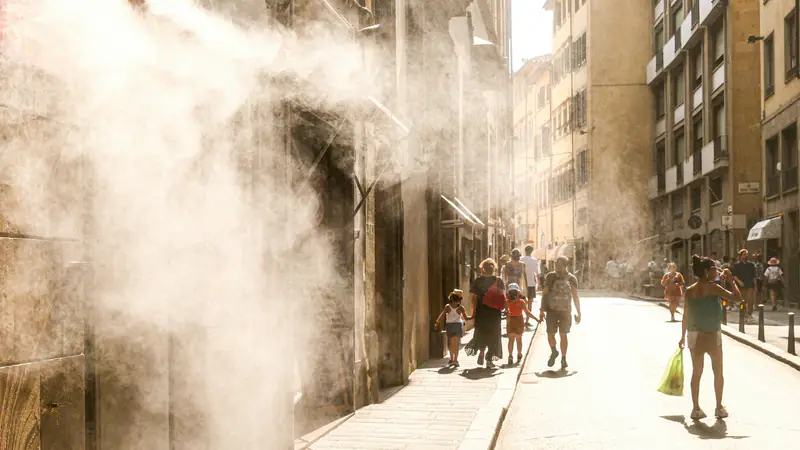
What is water shortage?
Two words are often mixed up. The European Commission uses drought for a temporary drop in the water that is normally available, for example after a winter with little rain. It is a natural event. Water scarcity is different: it describes a situation where demand for water often exceeds what the natural system can supply sustainably. It can last for a season, a year or several years.
The difference matters. A drought can end with one wet winter. Scarcity is about the balance between how much water we use and how much nature renews, so it calls for longer-term decisions. A drought can also push an area that is already close to the limit into scarcity.
How Europe measures it
The European Environment Agency tracks scarcity with the water exploitation index plus (WEI+). It compares the water consumed in a river basin with its renewable freshwater, season by season. Above 20%, water resources are considered under stress. Above 40%, the stress is severe and use may be unsustainable. The EEA notes that there is no formally agreed EU threshold.
In its indicator published in November 2025, with data for 2023, the EEA found that water scarcity affected 28% of EU land and 32% of its population in at least one season. It names Greece among the countries where scarcity happens mainly in spring and summer, and notes that in Europe it usually peaks between April and September, when it is dry and demand from farming and tourism is high.
Attica: what the reservoirs show
EYDAP, the Athens water company, supplies the capital mainly from four reservoirs, as listed on its water resources page: the large dams of Mornos and Evinos, the second built to boost the first, the natural lake of Yliki in Boeotia, which needs pumping because it lies lower than Athens, and Marathon, a backup and regulating reservoir. More than 100 boreholes in Attica and Boeotia act as a further reserve.
EYDAP publishes the total stock every day. Its reserves report for 3 November 2026 shows:
| Date | Total stock (m³) |
|---|---|
| 3 Nov 2026 | 570,721,000 |
| 1 Oct 2026 (start of the water year) | 582,940,000 |
| 3 Nov 2025 (same day last year) | 372,638,000 |
| 3 Nov 2015 (highest in EYDAP's series for this date) | 1,158,564,000 |
| 3 Nov 1993 (lowest in EYDAP's series for this date) | 107,704,898 |
Read together, these numbers tell a mixed story. Reserves are about half as high again as on the same day of 2025, when they were unusually low. But they are still under half of the 2015 level for the same day, and they have fallen since the start of October. On 3 November 2026 the reservoirs supplied about 1.02 million m³ in a single day.
Why one forecast is not enough
A tempting shortcut is to divide the stock by daily use. Our own rough sum (570.7 million ÷ 1.02 million) gives about 560 days. That number is close to meaningless on its own. It ignores the rain and snow still to come, evaporation from the lakes in summer, higher demand in heatwaves and the tourist season, and any new sources or savings. The real question is not "how many days are left?" but "what happens under the different winters we might get?"
That is where scenario analysis helps. Instead of one prediction, planners compare a few coherent futures, for example:
- A repeat of a very dry year: how low would the stock fall by next autumn, and when would emergency measures need to start?
- An average winter: how much would reserves recover, and is that enough for a hot summer with record visitors?
- A wet winter followed by rising demand: do good years hide a slow long-term decline?
Each scenario can then be crossed with decisions: fixing leaks, new sources, pricing, or campaigns to save water. The aim is to find choices that work reasonably well in all of them, not to bet everything on one.
Where a digital twin fits
A water twin would link reservoirs, rainfall and snow records, weather forecasts, demand by area and season, and the network itself, so these scenarios can be run quickly and checked against what really happens. Kassandra Labs is at concept stage and does not run such a model today. You can read how we think about this in how it works.
For official, day-by-day figures, the source to follow is EYDAP's own report.